Between rigging up a small LED matrix to my member storage and returning my 3D printer + webcam to the shop, the idea of measuring ambient light has come up several times. Finding a photoresistor to do this turned out to be beyond simple: a member gave me one to use. But once the thought had crossed my mind, I wanted to follow through with this LED sensor thing and see if it’s really up to snuff.
First, gotta find out how it all works. Easy: another shop member wrote a library for it. And the library references an Arduino page which describes the operation: Light Emitting Diodes are typically wired to produce light. But, if you attempt to apply reversed voltage, then the LED will reject current (it is a diode after all) and will do something I find pretty cool: it acts as a tiny capacitor. And even cooler: the capacitor’s characteristics will change based on how much light is reaching the LED’s substrate. So this library will “charge” the LED by applying VCC->VSS backwards on the device, and then measure the length of time it takes for the capacitor to discharge (which is dependent on the ambient light). Neat!
So let’s give it a shot:
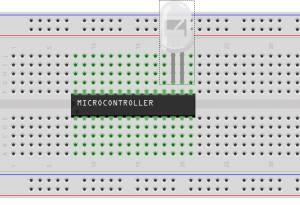
Wire up like so. In this layout we’d normally turn on the LED by driving pin D11 to VCC, and holding D12 low. Instead, we’ll use Tyler’s library to reverse the voltage and count the milliseconds until the LED reads low voltage as an input.
This works well, but I noticed some variations in the returned value from the LED. Let’s investigate:
Just by visual inspection, it looks like the time between samples affects the returned value. If you sample, wait a few seconds, and then sample twice in a row, all three values vary heavily. So I set up a timer to sample at intervals and collected the results:
| s_0.5 | s_1.0 | s_5.0 | s_10.0 | s_15.0 |
| 300 | 281 | 257 | 248 | 243 |
| 300 | 282 | 256 | 249 | 239 |
| 298 | 283 | 258 | 247 | 240 |
| 299 | 295 | 255 | 233 | 248 |
| 299 | 284 | 240 | 246 | 248 |
| 300 | 283 | 242 | 243 | 245 |
| 299 | 284 | 243 | 246 | 244 |
| 300 | 283 | 243 | 241 | 254 |
| 300 | 295 | 241 | 242 | 242 |
| 300 | 280 | 241 | 242 | 254 |
| 300 | 282 | 239 | 247 | 242 |
| 301 | 280 | 249 | 238 | 241 |
| 300 | 281 | 247 | 239 | 243 |
| 299 | 281 | 246 | 245 | 257 |
| 299 | 294 | 246 | 245 | 244 |
| 299 | 293 | 245 | 250 | 237 |
| 298 | 294 | 243 | 253 | 239 |
| 298 | 294 | 253 | 242 | 238 |
| 298 | 294 | 237 | 246 | 234 |
| 298 | 293 | 236 | 248 | 241 |
| 297 | 292 | 245 | 253 | 303 |
| 297 | 294 | 245 | 245 | 243 |
| 296 | 294 | 243 | 245 | 245 |
| 295 | 294 | 242 | 244 | 256 |
| 296 | 293 | 240 | 245 | 265 |
| 297 | 293 | 222 | 247 | 262 |
| 298 | 293 | 252 | 249 | 256 |
| 298 | 291 | 253 | 249 | 256 |
| 297 | 292 | 251 | 247 | 254 |
| 296 | 292 | 251 | 264 | 252 |
| 296 | 292 | 250 | 262 | 254 |
| 297 | 293 | 246 | 262 | 240 |
| 296 | 293 | 260 | 261 | 245 |
| 297 | 293 | 261 | 264 | 246 |
| 296 | 291 | 257 | 249 | 256 |
| 295 | 291 | 243 | 258 | 254 |
| 295 | 293 | 253 | 242 | 267 |
| 294 | 293 | 251 | 242 | 266 |
| 293 | 292 | 250 | 242 | 263 |
| 294 | 295 | 249 | 255 | 263 |
| 294 | 294 | 249 | 251 | 244 |
| 293 | 294 | 247 | 266 | 257 |
| 294 | 291 | 249 | 253 | 256 |
| 293 | 291 | 233 | 251 | 251 |
| 293 | 291 | 245 | 253 | 243 |
| 294 | 291 | 242 | 251 | 239 |
With at least 30 sequentially sampled values for each interval, we turn to pspp – the GNU statistical analysis tool.
GET DATA
  /TYPE=TXT
  /FILE="/home/berocs/vals.csv"
  /IMPORTCASES=ALL
  /ARRANGEMENT=DELIMITED
  /DELCASE=LINE
  /FIRSTCASE=2
  /DELIMITERS=","
  /VARIABLES=
    s_0.5 F3.0
    s_1.0 F3.0
    s_5.0 F3.0
    s_10.0 F3.0
    s_15.0 F3.0.

DESCRIPTIVES
    /VARIABLES= s_0.5 s_1.0 s_5.0 s_10.0 s_15.0
    /STATISTICS=DEFAULT RANGE.

Valid cases = 46; cases with missing value(s) = 0.
╭────────╥──┬──────┬───────┬─────┬───────┬───────╮
│Variable║ N│ Mean │Std Dev│Range│Minimum│Maximum│
╞════════╬══╪══════╪═══════╪═════╪═══════╪═══════╡
│s_0.5   ║46│297.09│   2.34│ 8.00│ 293.00│ 301.00│
│s_1.0   ║46│290.04│   5.00│15.00│ 280.00│ 295.00│
│s_5.0   ║46│246.65│   7.44│39.00│ 222.00│ 261.00│
│s_10.0  ║46│248.70│   7.35│33.00│ 233.00│ 266.00│
│s_15.0  ║46│250.20│  11.78│69.00│ 234.00│ 303.00│
╰────────╨──┴──────┴───────┴─────┴───────┴───────╯
Huh. Not quite what I expected. As the interval decreases, so does the error. It looks like if I want to use this library with long intervals, smoothing should be used.
Another round, this time each value is a hysteresis average: value = (value/2)+(raw/2)
GET DATA
  /TYPE=TXT
  /FILE="/home/berocs/vals_avg2.csv"
  /IMPORTCASES=ALL
  /ARRANGEMENT=DELIMITED
  /DELCASE=LINE
  /FIRSTCASE=2
  /DELIMITERS=","
  /VARIABLES=
    s15_avg2 F3.0.

DESCRIPTIVES
    /VARIABLES= s15_avg2
    /STATISTICS=DEFAULT RANGE.

Valid cases = 46; cases with missing value(s) = 0.
╭────────╥──┬──────┬───────┬─────┬───────┬───────╮
│Variable║ N│ Mean │Std Dev│Range│Minimum│Maximum│
╞════════╬══╪══════╪═══════╪═════╪═══════╪═══════╡
│s15_avg2║46│274.57│   6.59│27.00│ 264.00│ 291.00│
╰────────╨──┴──────┴───────┴─────┴───────┴───────╯
That’s a little better. Let’s go again with slightly more aggressive smoothing: value = (value*0.75)+(raw*0.25)
GET DATA
  /TYPE=TXT
  /FILE="/home/berocs/val_15s_a4.txt"
  /IMPORTCASES=ALL
  /ARRANGEMENT=DELIMITED
  /DELCASE=LINE
  /DELIMITERS=","
  /VARIABLES=
    s15_avg4 F3.0.

DESCRIPTIVES
    /VARIABLES= s15_avg4
    /STATISTICS=DEFAULT RANGE.

Valid cases = 46; cases with missing value(s) = 0.
╭────────╥──┬──────┬───────┬─────┬───────┬───────╮
│Variable║ N│ Mean │Std Dev│Range│Minimum│Maximum│
╞════════╬══╪══════╪═══════╪═════╪═══════╪═══════╡
│s15_avg4║46│304.78│   5.73│21.00│ 293.00│ 314.00│
╰────────╨──┴──────┴───────┴─────┴───────┴───────╯
Diminished returns, oh well. I’m particularly interested in the mean, which changes by a lot more than I’d like, about 50 points between tests.
So now we’ve established a decent idea of the operation with this particular LED (5mm, white), and a pretty solid operating value of 250-300ms for the lit lab. With a threshold of 350, the system works reliably to keep light available for the webcam!
** I’ve moved the LED to a more favorable location for collecting light form the overhead fixtures. The returned value is now reliable enough to require no smoothing.